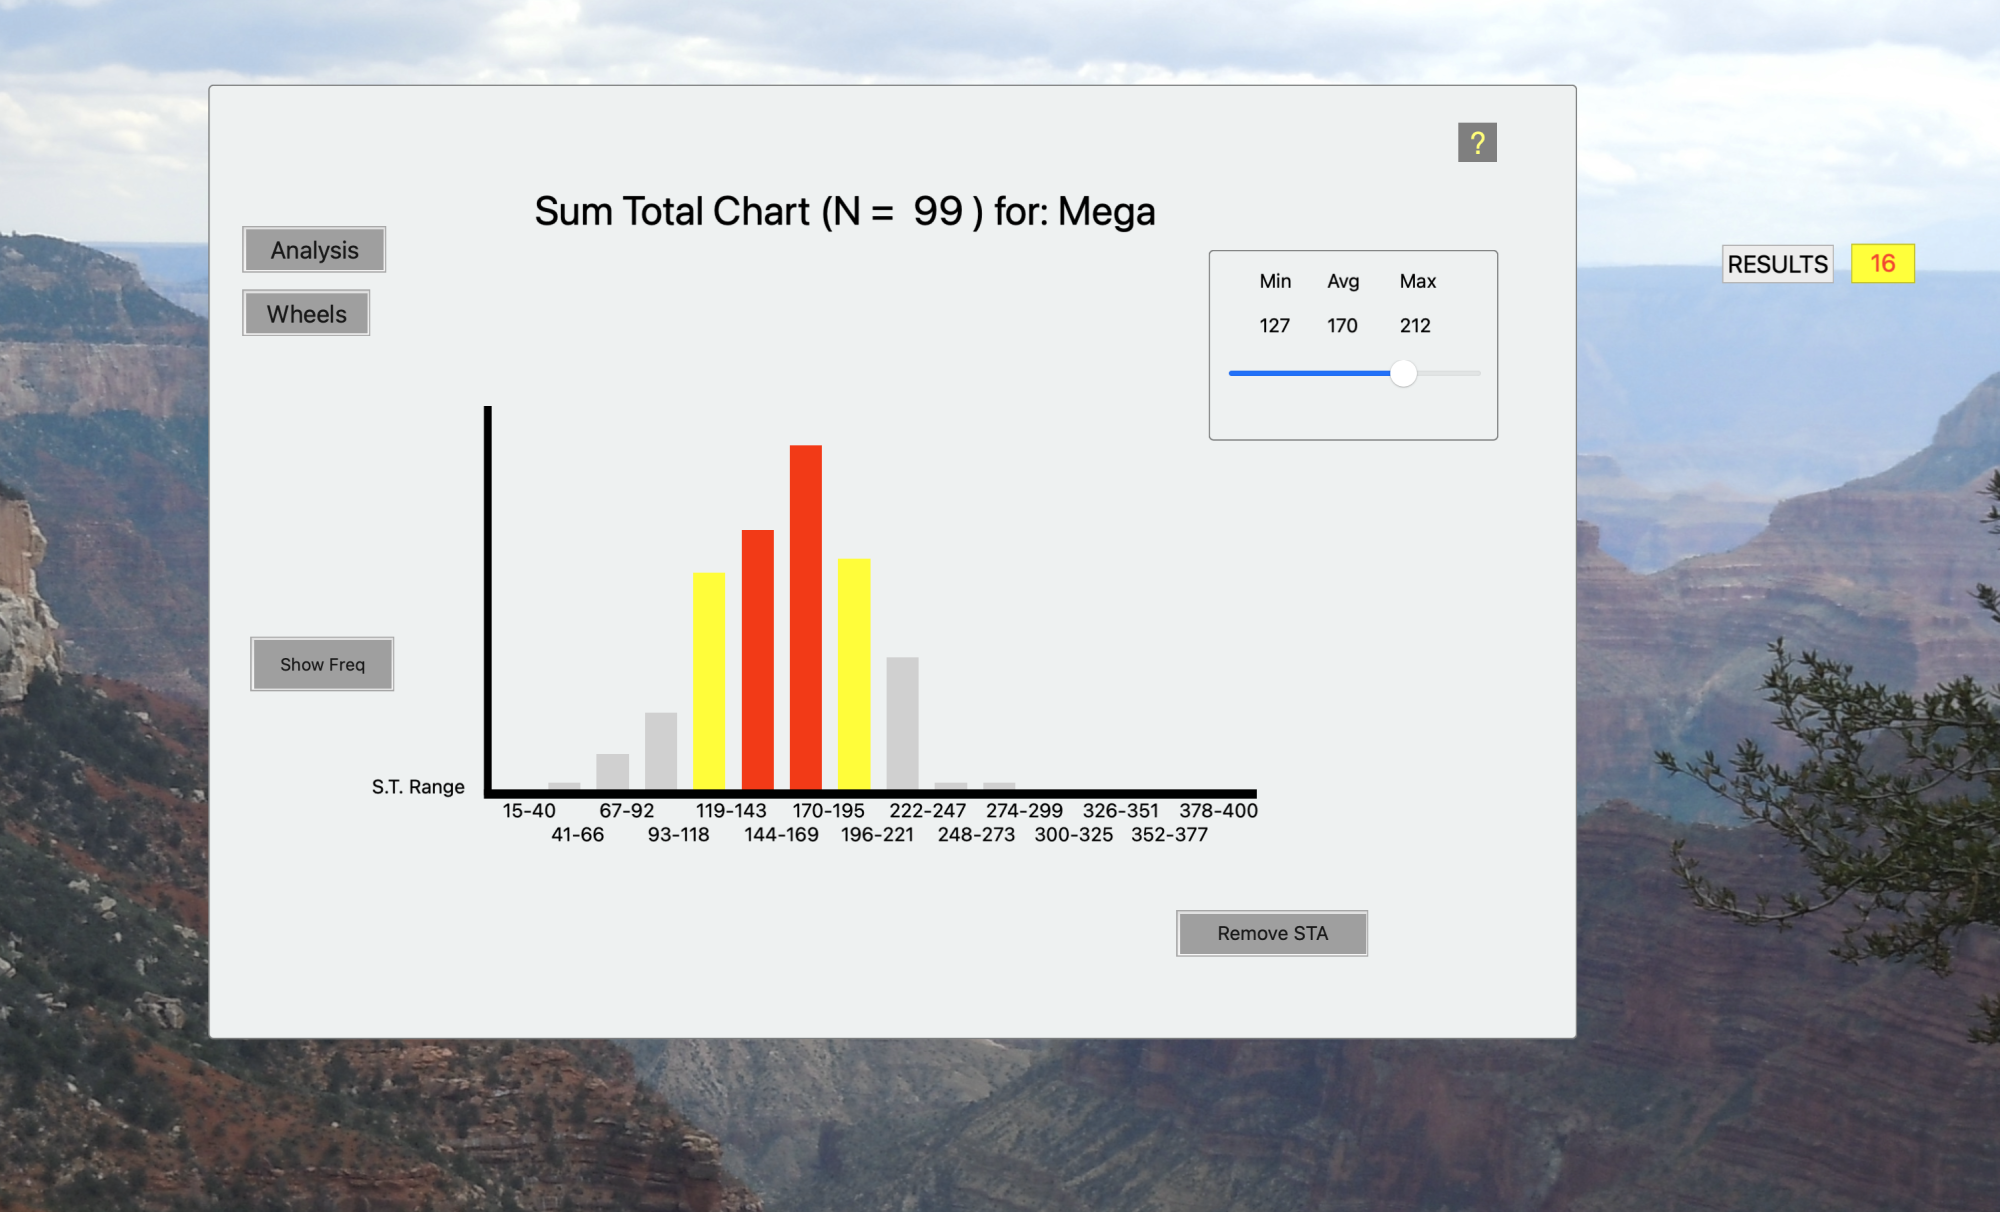
SUMMATION ANALYSIS (STA)
When viewing a 5-Ball Lotto chart with many previous draws, it becomes evident that 1-2-3-4-5 and 65-66-67-68-69 are typically never drawn. This analysis uses the "SUM" of each draw (1-2-3-4-5 equals a Sum of 15), appearing on the left of your chart, and 65+66+67+68+69 creating a Sum of 335 on the right. The middle of your chart represents the most frequently drawn Sums, being the "Sweet Spot," and the area in which your bets should be concentrated. SUMMATION ANALYSIS provides the (STA), allowing you to refine your betting range further.